How Investor Expectations Are Driving Stock Prices
Daniel Campbell
September 25, 2023
This year, there has been more optimism in the stock market compared to 2022. For investors only looking at the returns of the S&P 500, it may seem like the economy is in a boom. This dynamic may be surprising, given the rising interest rates and forecasts for slower growth.
“Expectations are like a debt that must be repaid.” – Morgan Housel
To make sense of what’s happening with stock performance this year, let’s start with some basics about stock valuations. First, know that expectations are built into every company’s stock price. Valuation theory teaches us that a company’s stock price is based on a combination of the company’s current value and its expected future cash flows, or what investors expect the company will earn over time.
One of the more popular ways to measure investors’ expectations is the earnings yield, which is simply a company’s earnings expressed as a percentage of its market price. It’s the inverse of the price-to-earnings (P/E) ratio, and just like with bonds, a higher yield suggests that the stock may earn more over time.* With that background, here are three insights from the earnings yields we see around the world today, which show why chasing the biggest returns in equity markets may not be the wisest choice.
1. The Big Companies Are Expensive
We generally see large positive returns from a stock for one of two reasons: unexpected improvements in business fundamentals or improved expectations for the company.
With technology stocks, we’ve seen a lot of the second scenario playing out. Nvidia, a maker of computer components that help artificial intelligence applications run effectively, nearly tripled in value through the first six months of the year. As of the end of June, the top five stocks in the S&P 500 comprised nearly 24% of the index value. On average, these top five companies are worth 10 times as much as the rest of the index, but they only yield about half as much. Warren Buffett offered sound advice when he said: “A business with terrific economics can be a bad investment if it is bought for too high a price.”
Tech is Dominating the S&P 500
2. The Price for Smaller, Less Expensive Companies Has Dropped
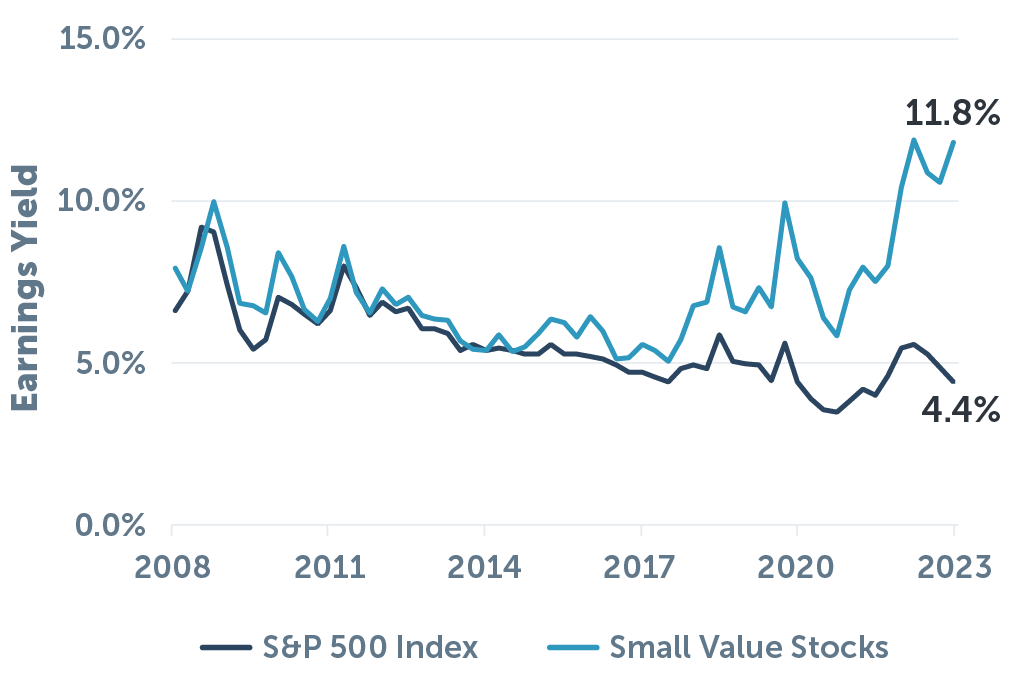
The optimism in U.S. stocks seems to be limited to large, established companies. Smaller companies in the U.S. are trading at significantly better yields. Specifically, companies that are inexpensive relative to their peers, what we call value companies, are seeing yields higher than during the 2008 financial crisis – they’re trading like we are already in a deep recession. Although that part might sound concerning, the higher yields show these stocks may be a great opportunity for investors who are focused on the long term.
Small Value Stocks Look Very Attractive
3. Investors Agree That International Stocks Are Risky
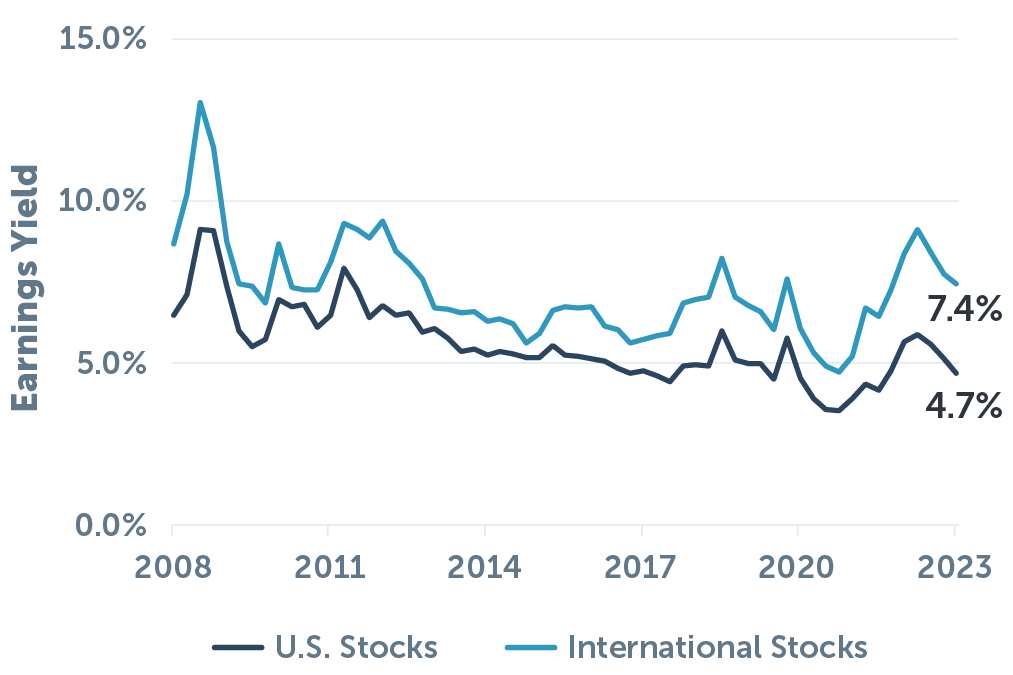
The U.S. has had a great 15 years of stock market performance. However, the outperformance in the U.S. has been driven by multiples expansion – investors have been willing to pay more per dollar of earnings from U.S. companies, at least partially because they are perceived to be safer investments than companies overseas. Compared to the latest earnings, international stocks are about one-third less expensive than their U.S. counterparts, meaning the yields on international stocks look quite a bit more attractive.
Prices Reflect Higher Risk Internationally
Good Years Will Come at Different Times
The media portrays certain indexes, such as the Dow Jones and S&P 500, so frequently that they have become the de facto barometer for how stocks are performing. However, these indexes only represent a portion of investable companies, and as we have seen, the largest companies can represent an outsized portion of the index returns. The earnings yield is one way to measure how good of a deal different stocks or regions are compared to their peers, and right now, the evidence suggests that leaning toward both international companies and small, less expensive companies offers an attractive opportunity for evidence-driven investors.
*This is an imperfect measure: a stock with a low earnings yield could go on to outperform, assuming the company can exceed the current expectations or make unexpected innovations in its field. But comparing differences in yields can give an indication of how high investors have priced their expectations for different companies or segments of the market.
Sources: Returns data were retrieved from Morningstar. Earnings yield data are based on trailing 12-month earnings. U.S. stocks are represented by the Russell 3000 Index. International stocks are represented by the MSCI World ex USA IMI. Small Value stocks are represented by the Russell 2000 Value Index. Holdings and concentration calculations for the S&P 500 Index are based on the holdings of the Vanguard S&P 500 Index Fund ETF (ticker: VOO). All returns and valuation metrics presented are through June 30, 2023. In Chart 1, Tech is Dominating the S&P 500, four companies had an earnings yield greater than 25% and were excluded from the visual.
For informational and educational purposes only and should not be construed as specific investment, accounting, legal, or tax advice. Certain information is based on third-party data and may become outdated or otherwise superseded without notice. Third-party information is deemed to be reliable, but its accuracy and completeness cannot be guaranteed. Indices are not available for direct investment. Their performance does not reflect the expenses associated with the management of an actual portfolio nor do indices represent results of actual trading. Information from sources deemed reliable, but its accuracy cannot be guaranteed. Performance is historical and does not guarantee future results. All investments involve risk, including loss of principal. By clicking any of the links above, you acknowledge that they are solely for your convenience, and do not necessarily imply any affiliations, sponsorships, endorsements or representations whatsoever by us regarding third-party websites. Buckingham is not responsible for the content, availability or privacy policies of these sites, and shall not be responsible or liable for any information, opinions, advice, products or services available on or through them. Neither the Securities and Exchange Commission (SEC) nor any other federal or state agency have approved, determined the accuracy, or confirmed the accuracy of this article. R-23-6175

Daniel Campbell
Senior Investment Strategist
As a Senior Investment Strategist at Buckingham, Dan spends his days helping clients and advisors understand and implement an evidence-driven investment strategy. As a CFA Sharterholder, Dan has a demonstrated ability to understand complex investment topics, but he gets the most energy from conversations with individuals and families in pursuit of financial freedom. When he’s not working, you can find Dan camping with his wife and three young kids or exploring the trails of Colorado.


